index >fare discrepancies report
 |
index >fare discrepancies report |
If the cars have been wired up and configured to read fares from the meter, you can use this report to view any discrepancies between the fare that was read from the meter and the fare that the driver entered into the fare payment screen after a job.
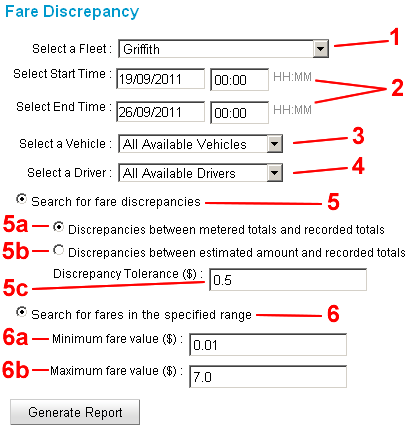
Select the fleet (1) and the start and end time for the report (2). Select a vehicle (3) and/or driver (4) if necessary. Next, select whether you want to search for discrepancies between the metered and recorded fares (5) or search for recorded fares within a specified range to view any discrepancies (6).
If Search for fare discrepancies is selected, you can choose to either search for discrepancies between the value that was read from the meter and the value that was entered by the driver (5a) or between the estimated value at the time of booking and the value that was entered by the driver (5b). Enter the Discrepancy Tolerance (5c) which means only show discrepancies that are more/less (+/-) than the tolerance.
If Search for fares in the specified range is selected, enter the minimum (6a) and maximum (6b) values in the range. The results will show all recorded fares that are within the specified range.
 |
The Discrepancy between metered totals and recorded totals report lists (only those jobs that have a discrepancy > than the tolerance will be shown):
The Discrepancy between estimated amount and recorded totals report lists (only those jobs that have a discrepancy > than the tolerance will be shown):
The Fares within the specified range report lists only those jobs that have a recorded total within the specified range:
At the top of the table there are two buttons and one field used to print the report, save the report so it can be opened and manipulated in a spreadsheet and filter the results in report respectively.
Printing the report – you can print the report by pressing the print button at the top of the table. Pressing the button will open up another browser window that can then be printed. Note that your browser settings must allow pop ups for this feature to work.
Saving the report – you can save the report as a comma separated file (.csv) so that it can be loaded into a spreadsheet for manipulation/analysis. Pressing the button will pop up a dialogue box where you can save the report as a .csv file.
Filtering the report – this text box allows you to type in characters to filter the report. For example, you can filter the results that have the word “David” or the number “9”. Only those results containing the characters typed into the text box will be displayed and will affect what is printed and saved.